Driver Evaluation
Rebuilt trust in a data-heavy fleet product, monthly users 4k→5k, churn 10%→6%
About Driver Evaluation
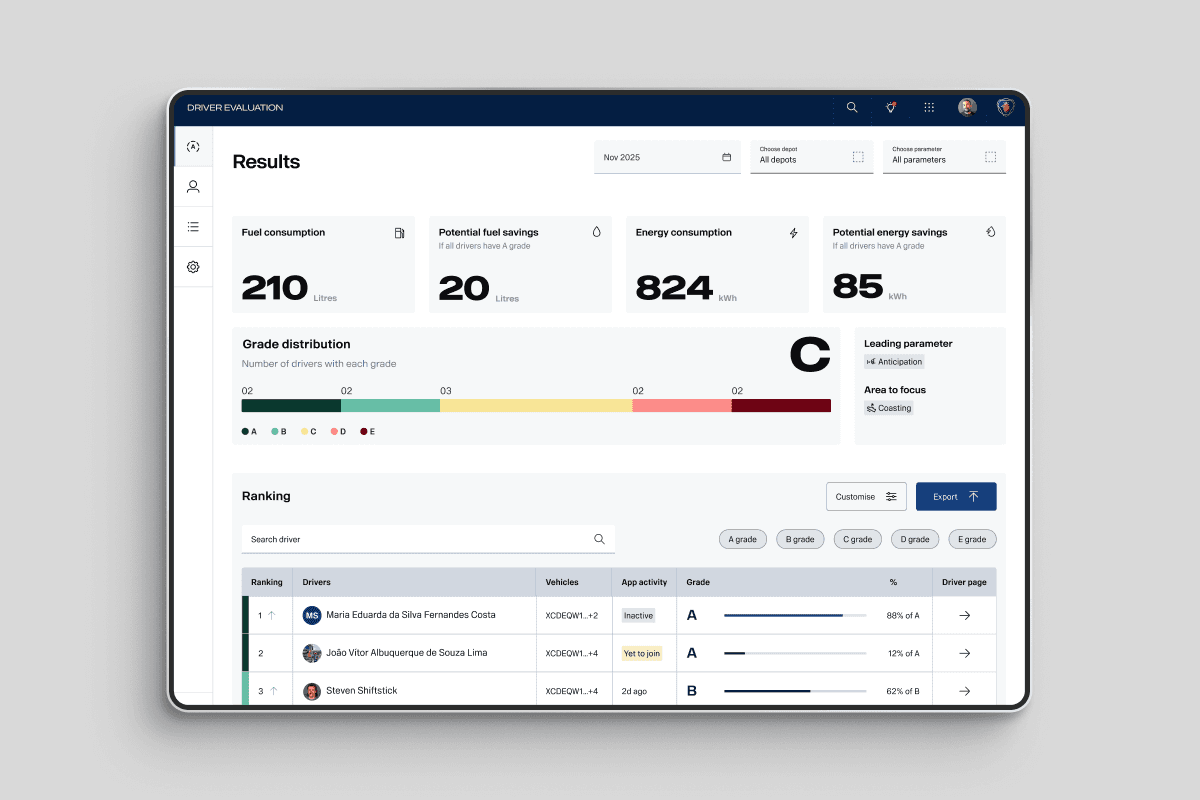
Driver Evaluation turns telematics data into performance feedback across behaviours like speeding, idling, and hill driving fleet visibility for managers, personal scores and benchmarks for drivers.
It only works if people trust it. Get that wrong, and it sits ignored and churns
Outcome
-4% Churn
Role
UX Designer
No. of Users
4k->5k Fleet Managers
challenge
How might we rebuild trust in a system everyone already doubted?
Problem
Fleet managers didn't believe the scores. Drivers argued the grades were unjustified, the number didn't match what they'd actually done on the road. Engagement and retention suffered.
Opportunity
The easy read was that the interface was the problem. It wasn't.

process
I assumed it was calibration
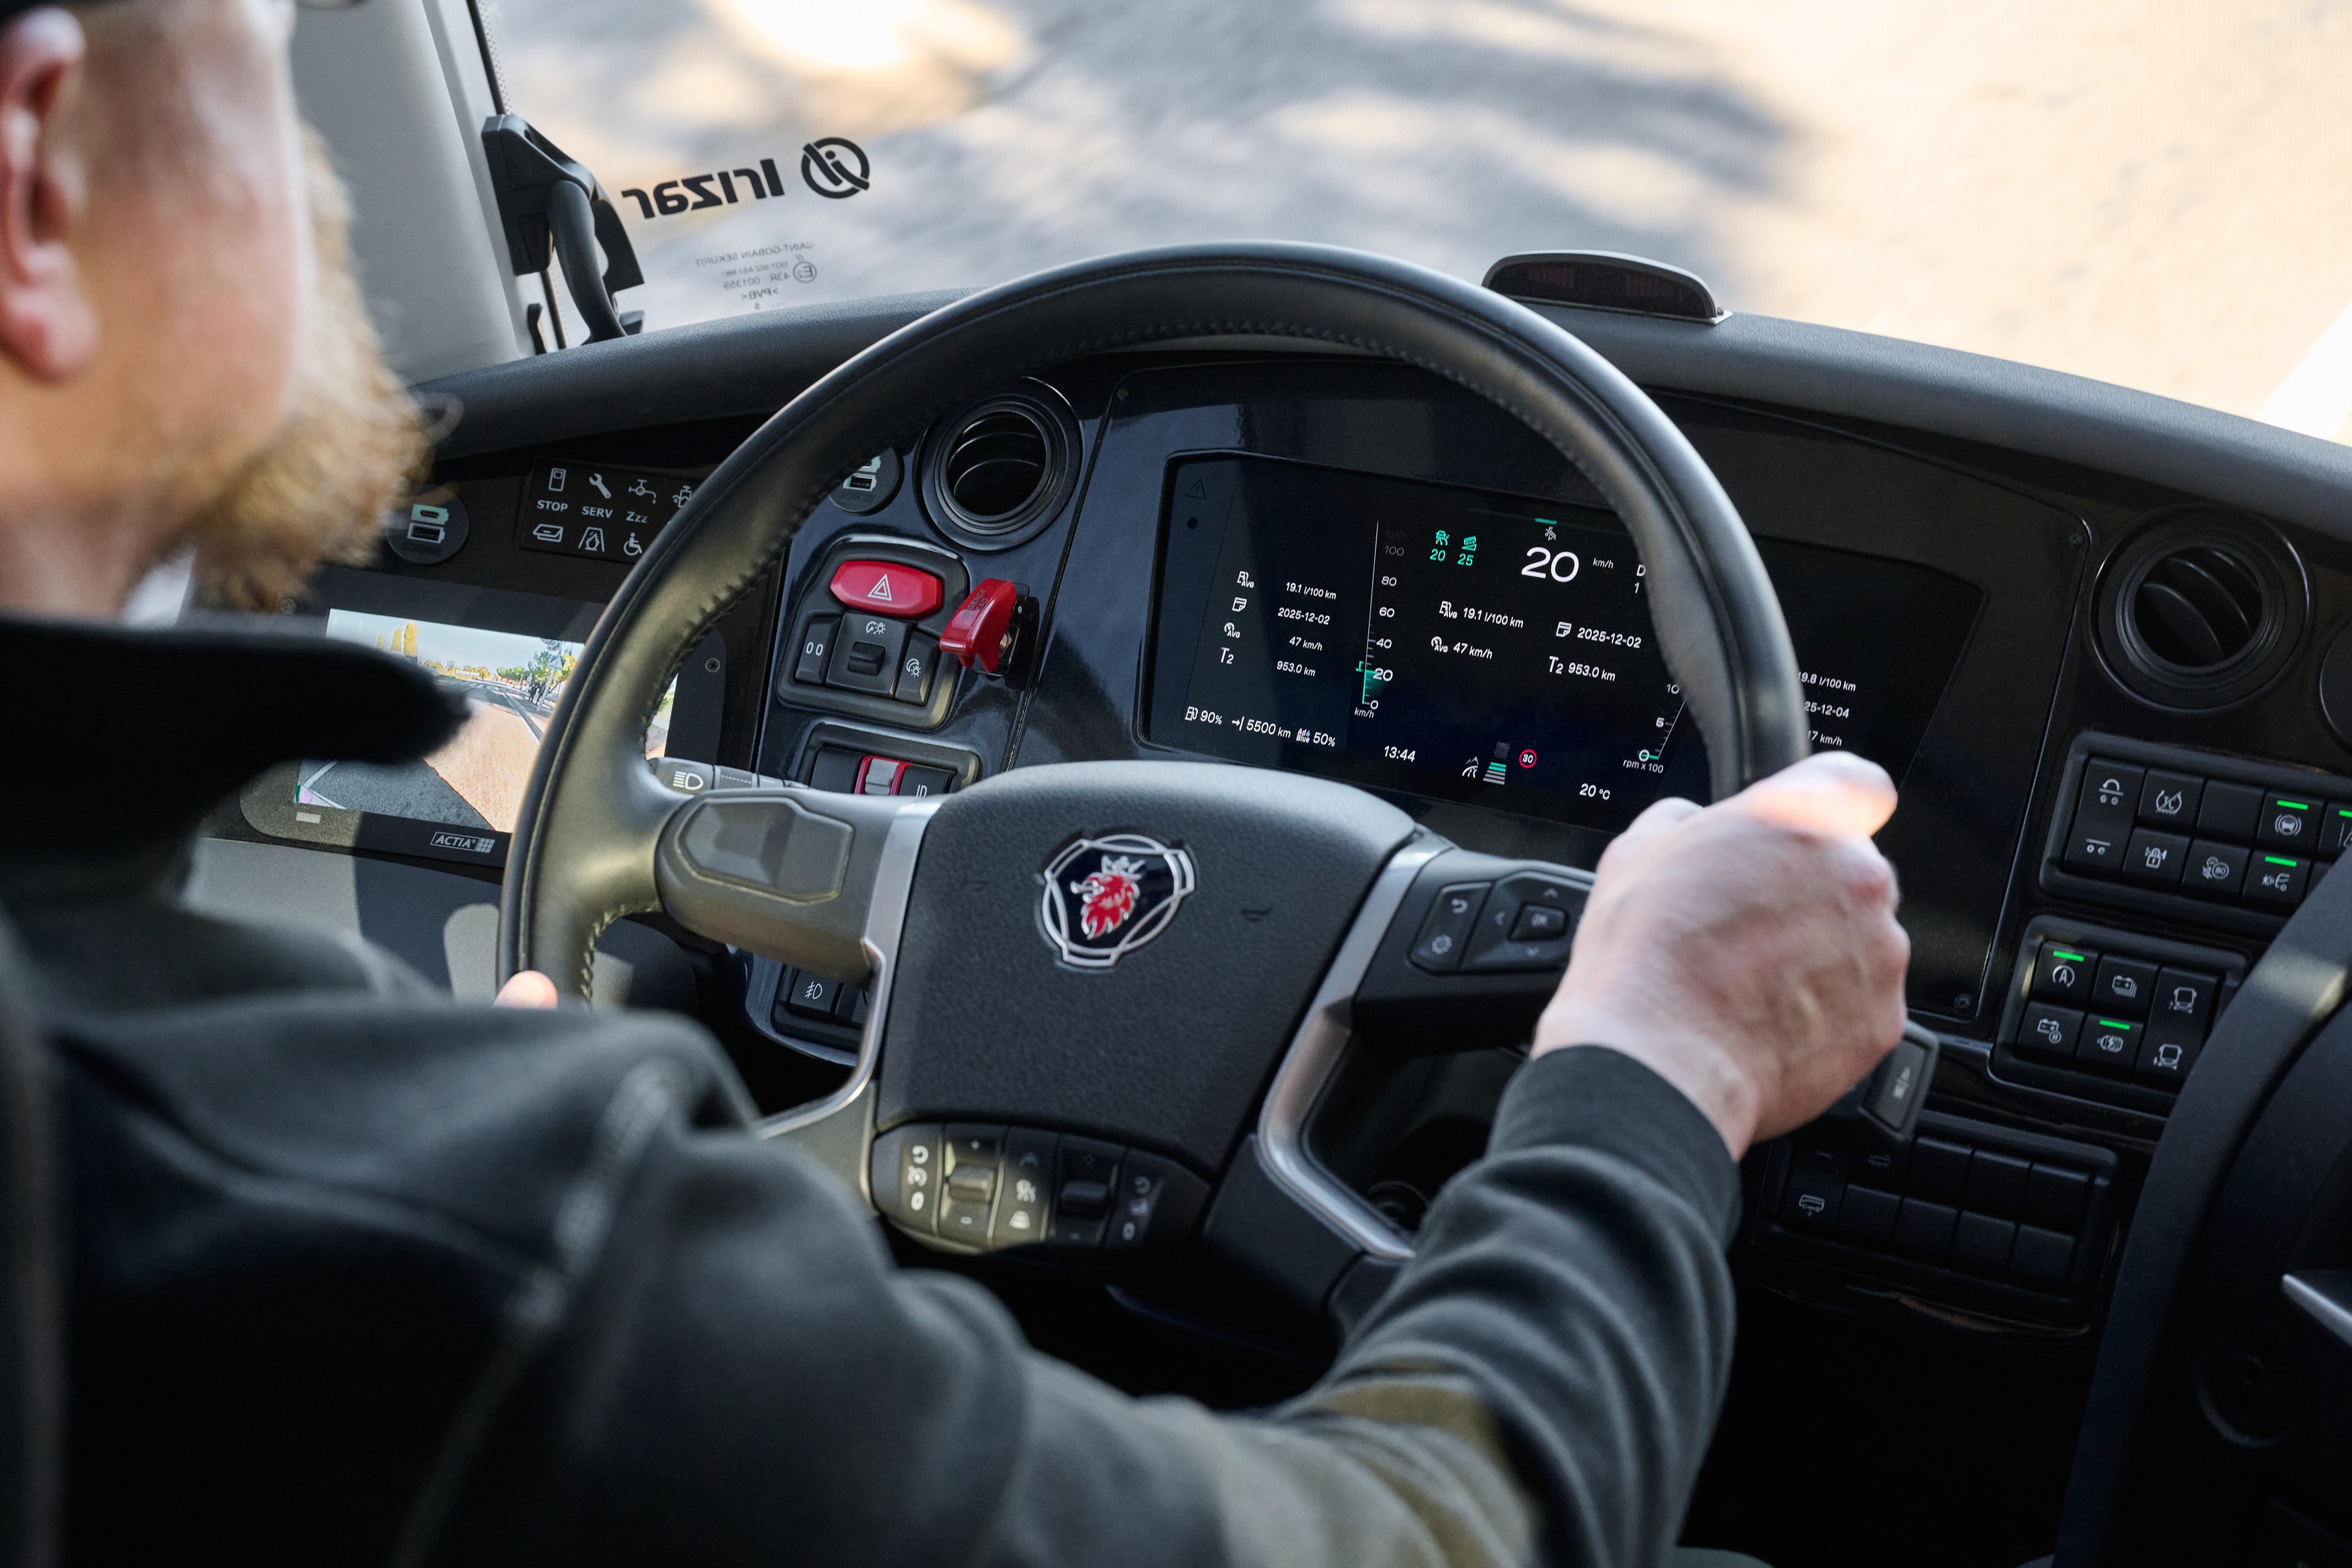
Thresholds off, a tuning fix. Then I rode in the cab.
The model wasn't mistuned it was thin
Country, distance, speed. No topography, no axle weight, no fuel type. Drivers were right not to trust a number that ignored the hill they'd just climbed or the load they were hauling.
Project was reframed
Not a better-looking score a score worth trusting. The model needed topography, vehicle and axle weight, and fuel type, not a fresh coat of UI.
Strategy change was the hard part
It was the decision: pause the feature roadmap for a year to rebuild the foundation. I made the case to my product owner no feature lands on a product people don't believe. I got the buyin from the team
Trust as the goal, not feature count
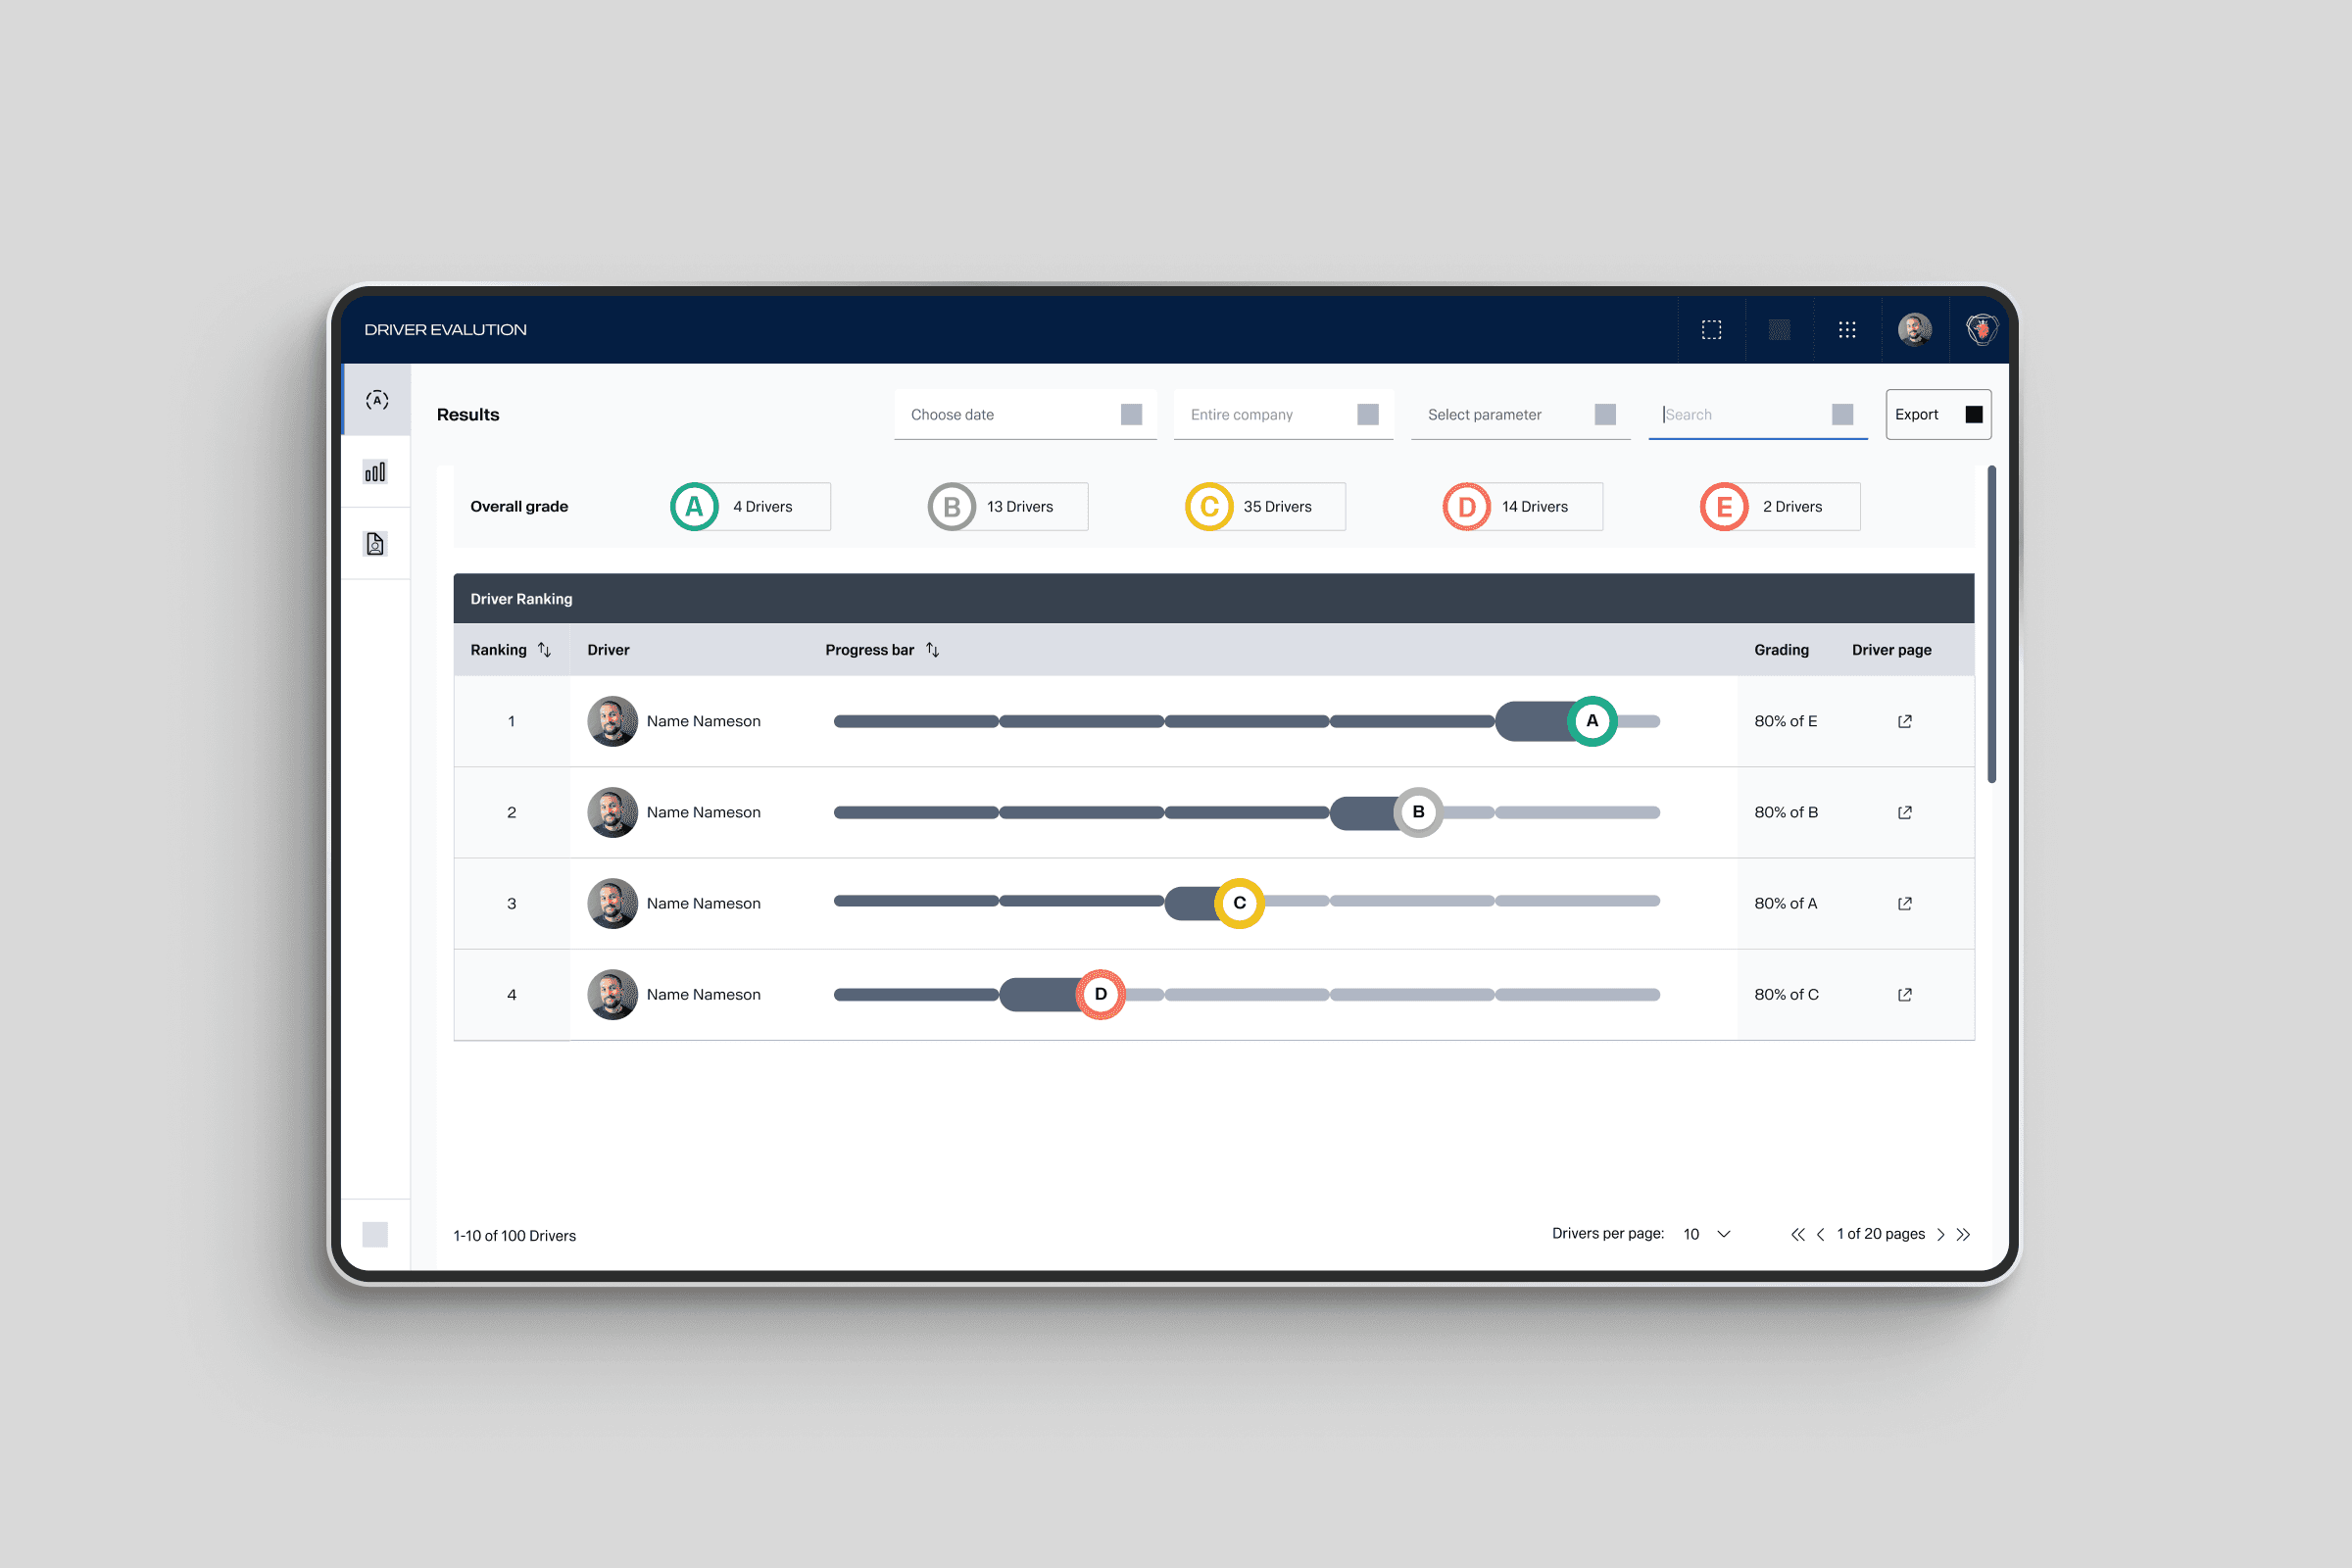
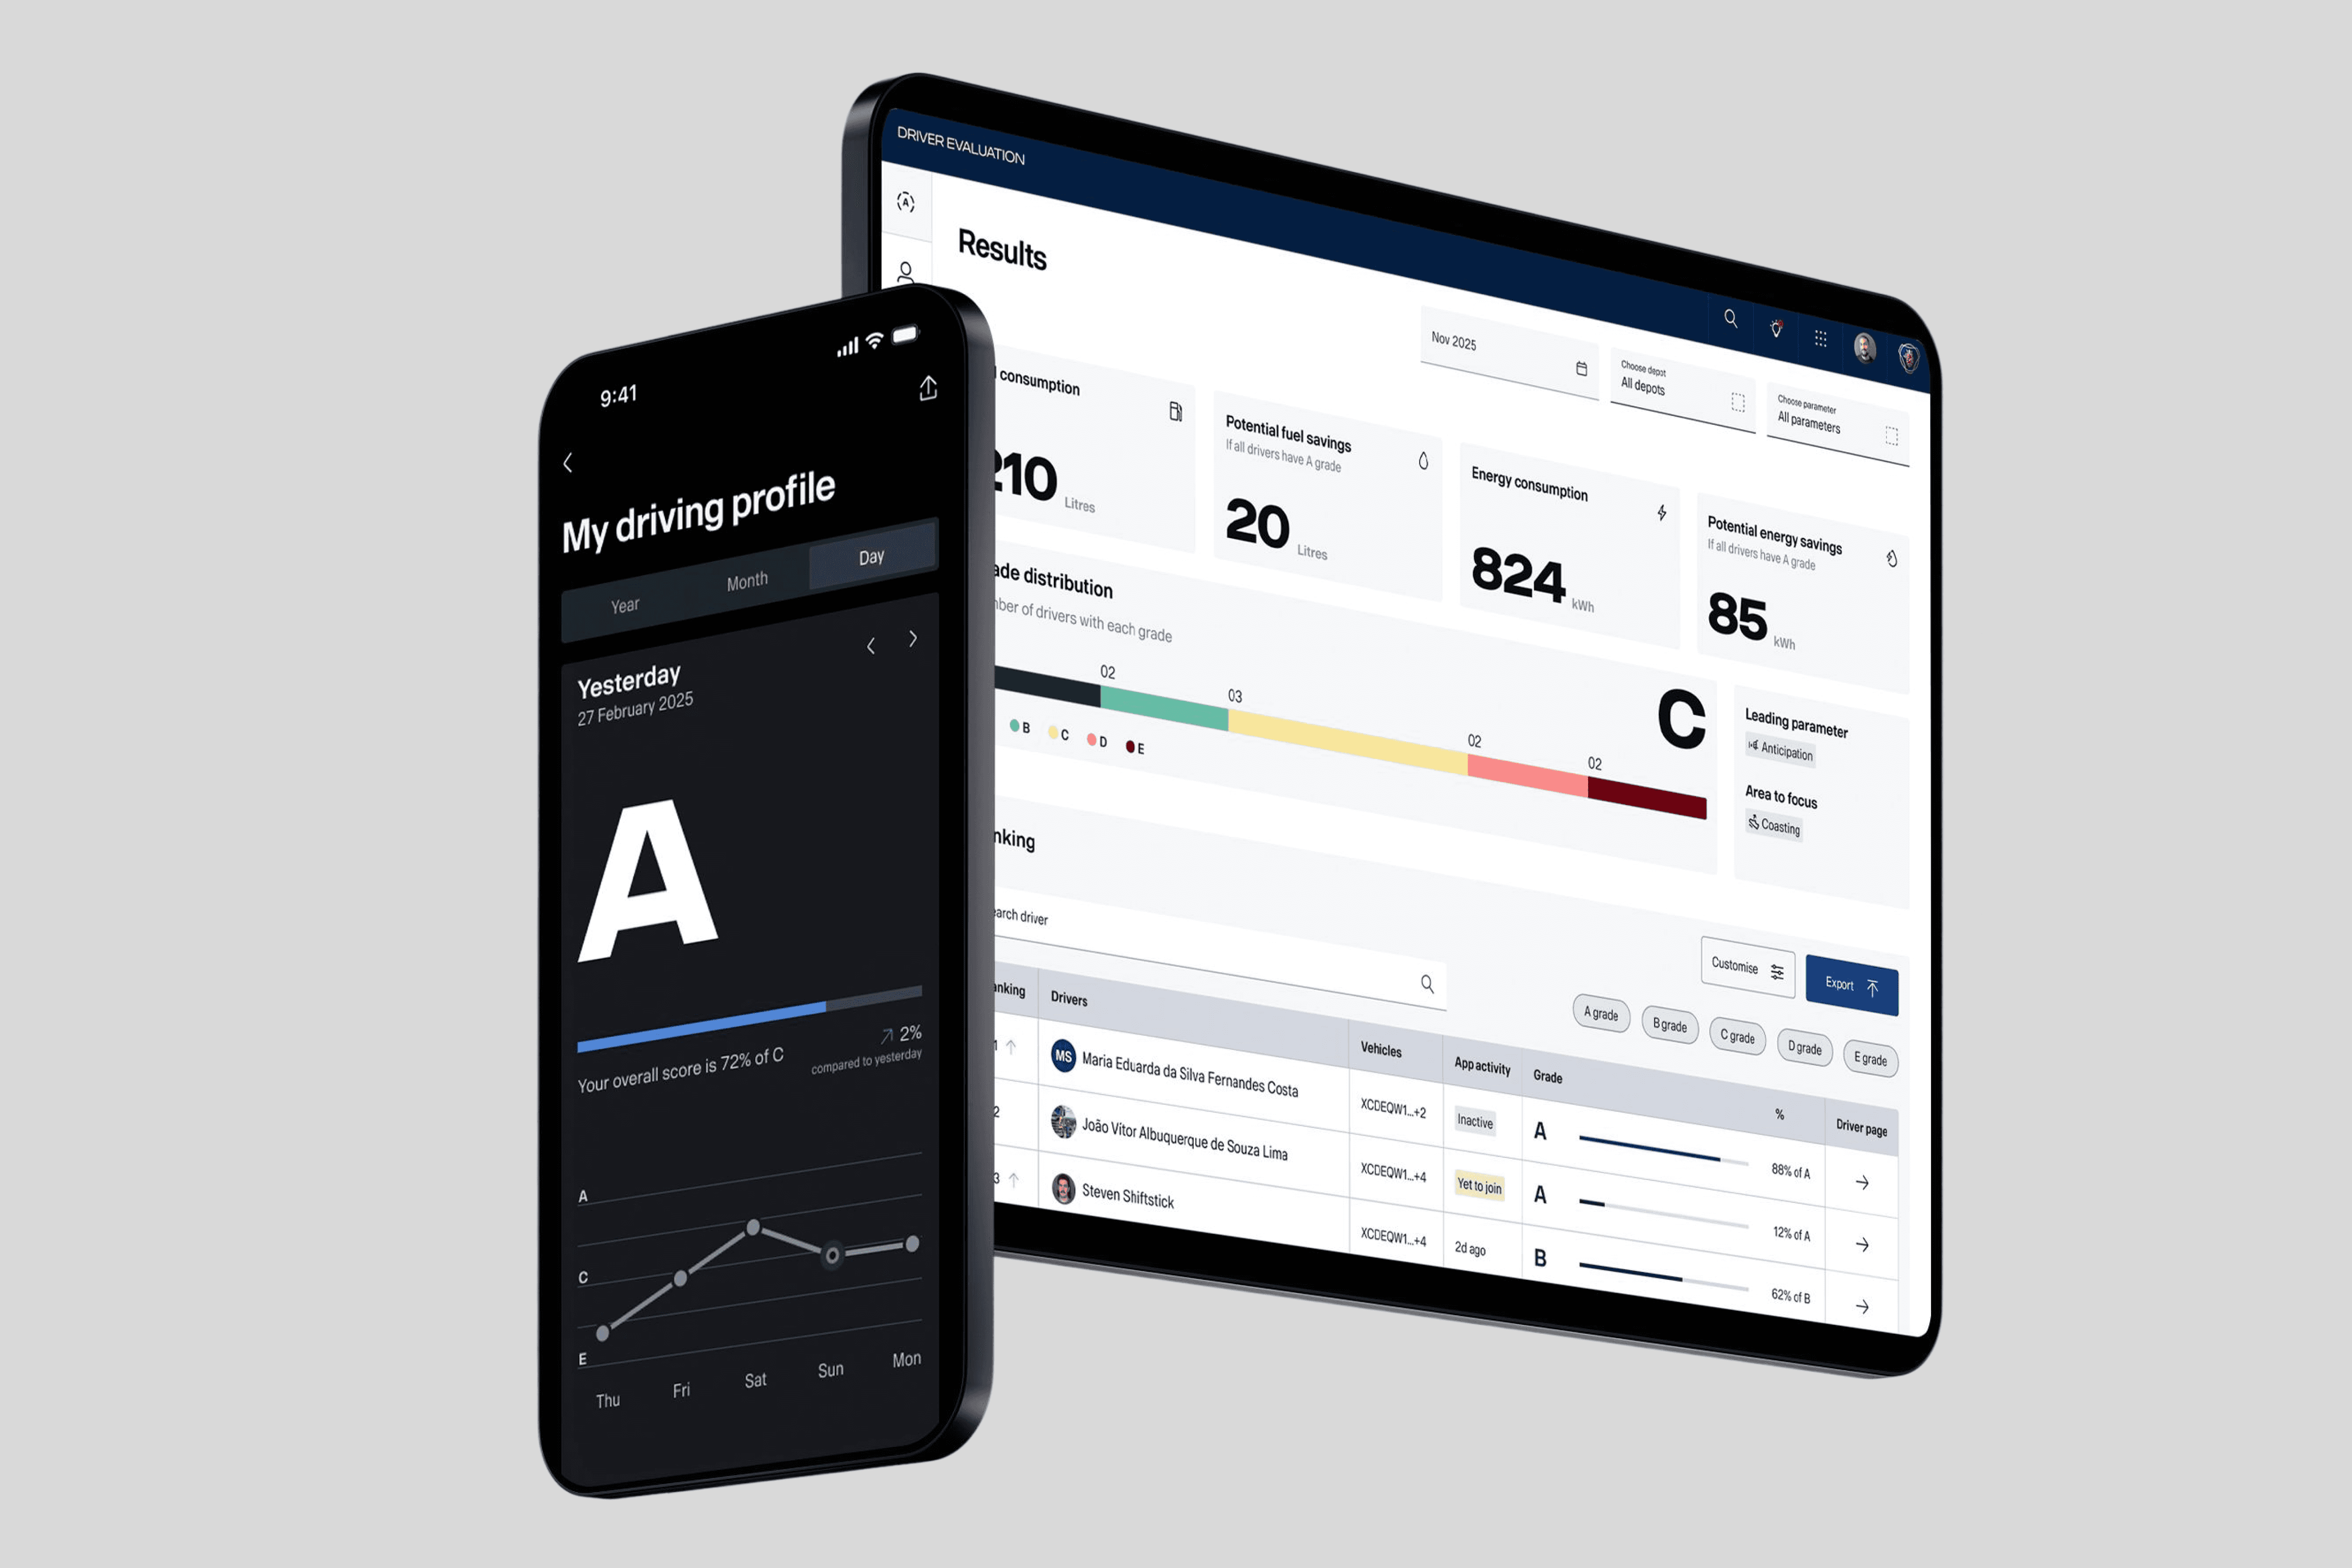
The interface simplified itself: five pages to three. Fuel consumption folded into the overview graph. The standalone driver data page became a table inside the driver view. Less surface, less noise, more signal.
Outcome
4k → 5k
monthly active users
10% → 6%
churn
1M+
drivers affected
More people using it, fewer leaving. A data heavy product became more valuable by showing less, not more.